Research priority 3: Visual analysis of collective behaviour
Participating researchers:

Collective behavioural patterns obtained from movement data are subject to complex rules.
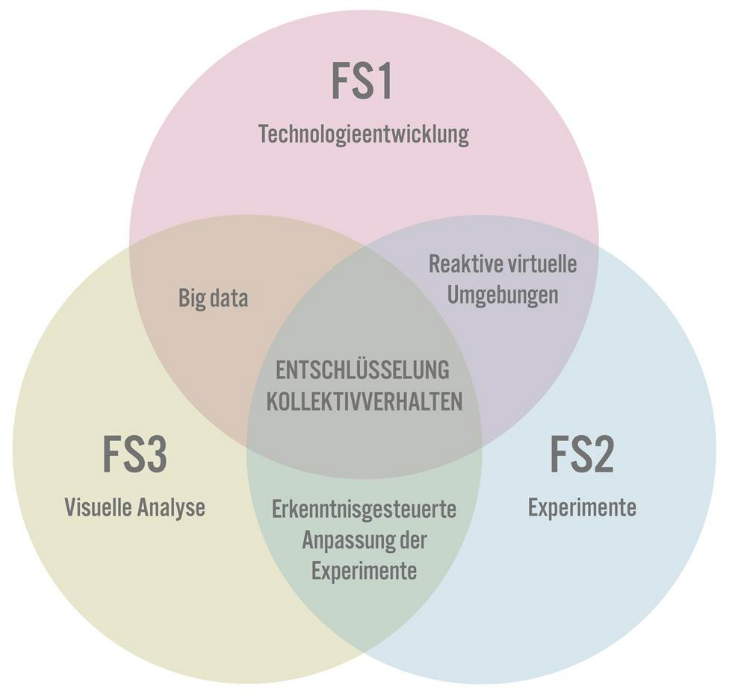
To decode the underlying rules, the multi-dimensional mass data generated by the experiments conducted in research priority 2 at the VCC and in the field are uploaded to the existing Movebank database. They are then visualized and analyzed using the VCC’s Data Theatre Lab and its ultra-high-resolution large-screen projection facility. From a technical perspective, there are two approaches to interpreting and analyzing collective movement data.
Movement data can be analyzed and depicted in the context of space and time. This is important for uncovering temporal and spatial developments and dependencies. In the context of collective behaviour, however, interactions and the relations between individual actors also play an important role. This is why collective behaviour can also be viewed in terms of a dynamic network that requires special kinds of analyses. A deeper understanding of the temporal and spatial dependencies as well as of the collective network in turn prompts new research questions that have repercussions for the experiments performed in research priority 2 and for the virtual environments generated in research priority 1.
By default, analyzing large quantities of movement data across all of their spatial and temporal dimensions is challenging. The data sets connect spatial information, for instance x and y coordinates associated with a data point, with the temporal dimension as well as additional multi-dimensional background information. The higher the resolution, the larger the data sets and the more comprehensive the information they contain. At the same time, it is becoming ever more difficult to process the collected masses of data efficiently. Illustration 4 shows a visual analysis system that was developed for the MoveVRE project, which studied the flight routes of albatrosses migrating between the Peruvian coast and their breeding grounds on the Galapagos Islands. To answer the question as to why the albatrosses chose a much longer route when returning, the available spatio-temporal movement data had to be put in the context of additional background information.
When analyzing the data, it is necessary to determine the swarm's movements in real time, which helps us control the reactive virtual environments created in research priority 1 and put to use in the experiments conducted in research priority 2. Processing speed is key in real-time analysis. For the reactive virtual environments to work as intended, this is in the millisecond range. It is impossible to examine the interactions between individuals at the same time. This happens offline, using a detailed a posteriori analysis of the recorded data. The overall aim is to gain a deeper understanding of collective behaviour. A semantically meaningful analysis of complex multi-dimensional movement data requires a combination of automatic data mining processes and interactive visualization technologies. In the expert literature, this combination of techniques has been termed "visual analytics".
